
-Stage 3.2-
Topographic Maps
Example of Topographic Map
(actual scan of the Bow Quadrangle in Washington)
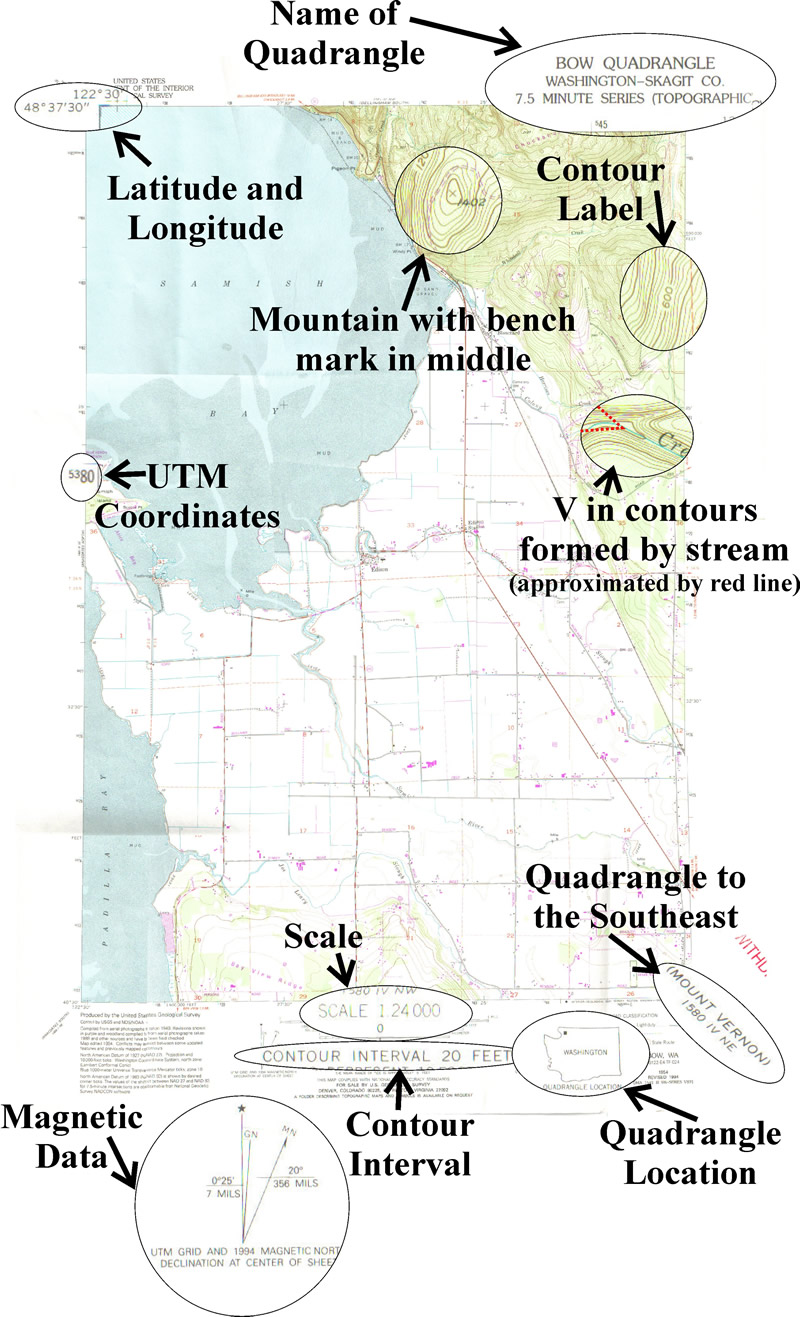
In the map above most of the information highlighted was mentioned on the Map Basics Page. Most of the remaining information is described below in the Understanding Topo Maps sections. The only things left are:
- Along the corners of topo maps and usually along the edges are the names of the adjacent topo maps to help people that are following objects like roads or trails to find the right topo map faster.
- There is usually a map of the state to show the location of region covered in the map.
The map above is part of the Geneseo Quadrangle in New York. A quadrangle is a portion of the earth that is exactly 7.5 minutes wide and 7.5 minutes high in latitude and longitude measurements. Most topographic maps are published as quadrangles.
Elevation - The elevation of the land is its height compared with sea level, which is considered to have an elevation of 0.
Contour lines - These are the lines running all over the map. They are lines that connect equal points of elevation together. This essentially gives the map a third dimension, depth without actually coming off the page.
1. Since they connect equal points of elevation, contour lines can NEVER cross. Otherwise that would mean that one spot has 2 different elevations.
2. Contour lines always join together to form a loop. Although this often does not occur within the field of the map
3. Contour lines never split
4. The spacing of the contour lines indicates the angle of the slope of the area:
- Far apart lines show little or no change in elevation - hence a flat area, like in the middle of the map
- Closely spaced lines indicate a steep change in elevation
- Evenly spaced lines indicate a constant slope
- Uneven spacing indicates an inconsistent slope
5. Hills are represented by circles with the peak of the hill located within the smallest circle
6. Depressions are represent by circles with hash marks (short lines pointing towards the center of the circle) to differentiate them from hills
7. When contours cross streams they always point upstream. The steeper the valley, the sharper the point
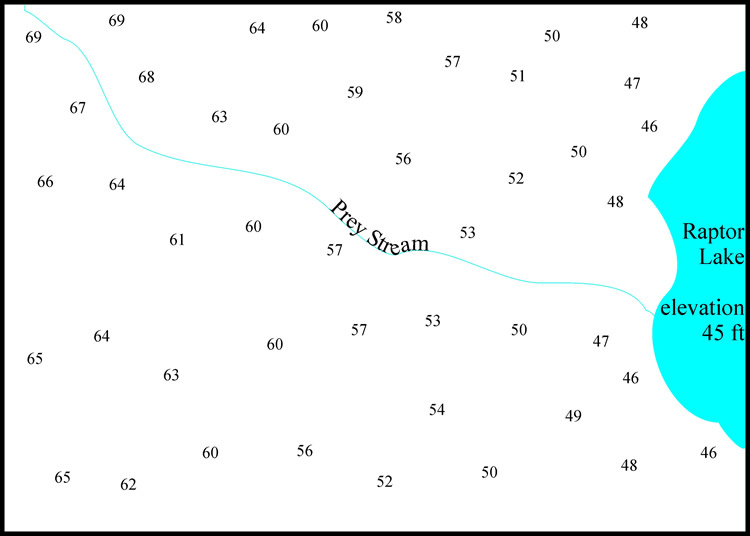
Once you understand the basics of topographic maps, you can then create your own maps. The creation of topographic maps helps to further understand map basics. The type of map below is commonly used as a lesson to teach people how to draw contours when only some elevations are known. When drawing the map use the rules listed above.
Drawing Contours: "Easy" Map
Drawing Contours: "Easy" Map Answers
Contour interval is 5ft
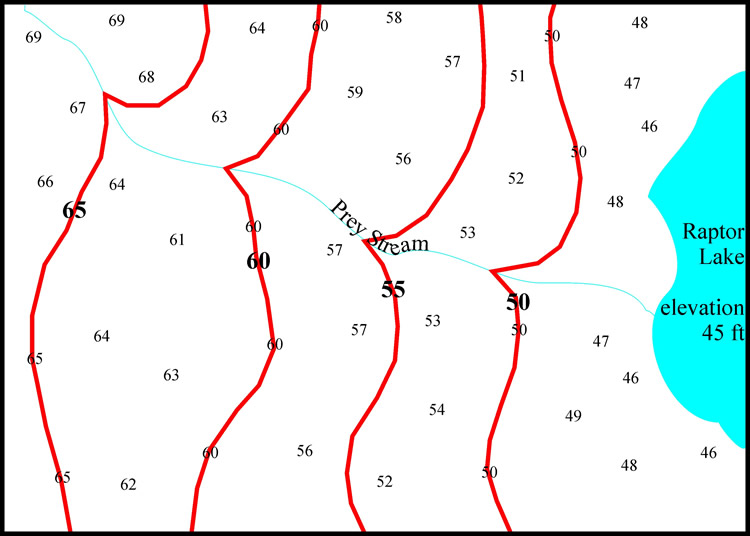
Some notes to the above contour map
-
Always label all your lines.
-
Even though some lines like "55" don't have any elevation markers it still has a contour line.
-
The location of the lines are estimated based on what is known.
-
Contour line "70 " is not drawn since you don't know how high the map goes.
-
When the contours cross the stream the stream valley causes a "V" in the contours.
-
The "V"s point "up-stream" (AKA up-hill).
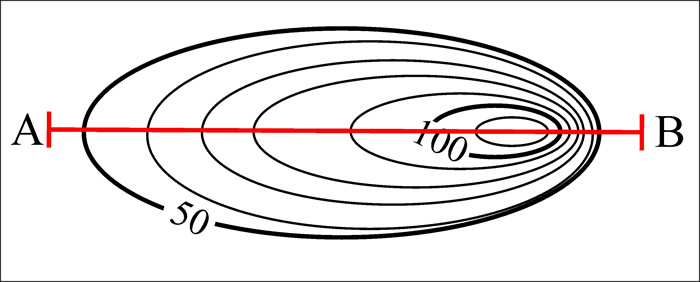
A topographic profile is taking a flat image of a topographic map and producing an image of the map from the side. Essentially this is taking a view of a mountain from the top down and then drawing it from the side. This is a fairly simple concept to understand and once understood is quick and simple to do.
Rules and Method
When drawing a profile first you need a section of map that your going to draw your profile on. (Line A-B)
Next you take a sheet of paper and mark off each line that intersects the A-B line.
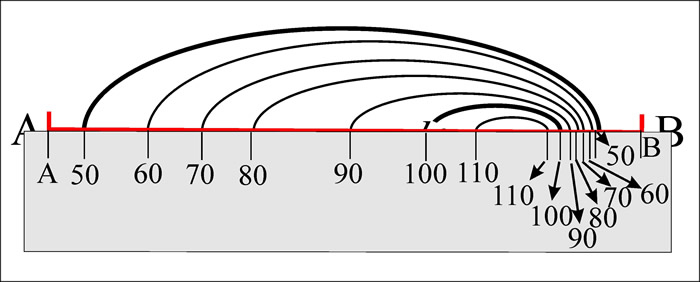
Looking at the original contour lines, you can see that only two of them were marked, but since you can see that there are 5 lines between each marked line you can figure out that each line is 10 apart (also known as the "contour interval").
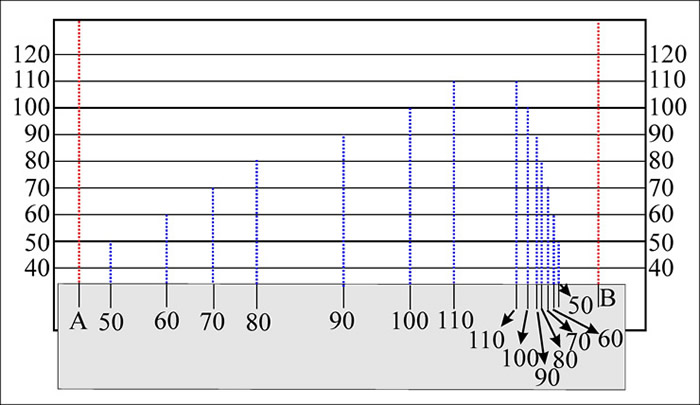
After the lines are copied and labeled you can then copy this onto a topographic profile. This can be either supplied or created.
Then connect the points together to form on smooth curve.
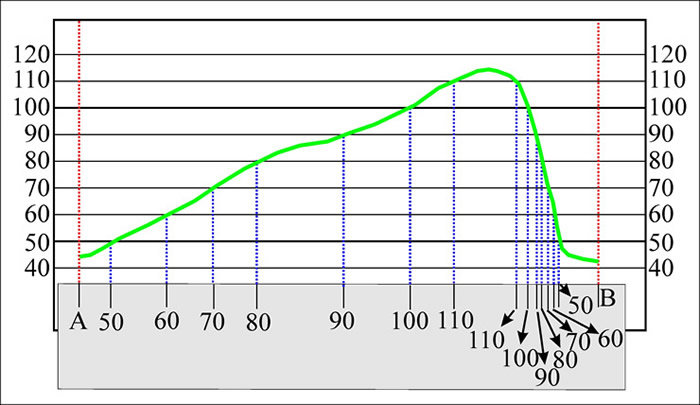
Notes:
99% of all hills don't have flat tops so don't give yours one.
If it doesn't cross a topo-line don't make the profile cross one.
And there you have a basic topographic profile.
Vertical exaggeration (VE) is how much the profile of the landscape is exaggerated.
ex. Whether a mountain looks like a mole hill or Mount Everest
- Calculating VE -
VE = Vertical Scale/ Horizontal Scale
The vertical scale is the scale measure on the profile. Using the profile above 1" on the profile equals about 50 ft, so:
1" = 50'
1" = 600"
Vertical Scale = 1/600
The horizontal scale is the measure scale on the map. This is always given to you and is usually 1/24,000 on most topomaps:
Horizontal Scale = 1/24,000
VE = (1/600) / (1/24,000)
VE = 24,000/600
VE = 40x
The label "x" stands for times since there are no real units.
A large VE means a greatly exaggerated landscape, while a small VE means a flattened landscape.
